BofA每週資金流向與總經報告
2026-09-16 · 含原圖
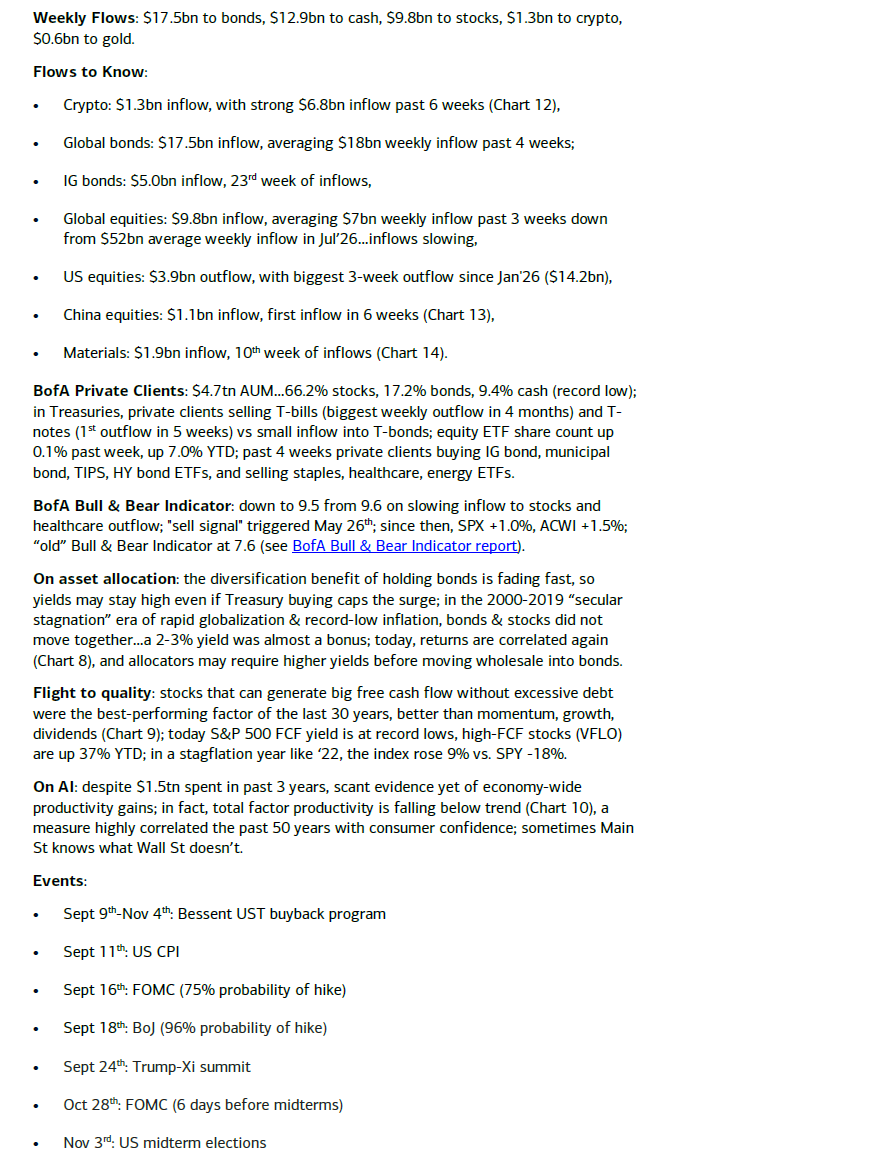
image_3.png 詳細分析報告
1. 圖片類型與整體說明
- 圖片類型:這是一張純文字排版的市場分析與研究報告摘要(文件截圖 / 研究筆記截圖)。
- 整體說明:該圖片擷取自美國銀行(Bank of America, BofA)每週發布的全球資金流向與宏觀觀點報告(Flow Show / Market Notes)。內容涵蓋了最新的每週全球資產資金流入與流出數據、美銀私人客戶的資產配置狀況、美銀牛熊指標(BofA Bull & Bear Indicator)讀數、股債資產配置觀點、自由現金流(FCF)因子的歷史表現、AI 投資對總體經濟生產力影響的研判,以及 9 月至 11 月重要總體經濟與政治事件時程表。
2. 所有可見文字(逐字擷取)
以下為圖中出現的所有英文文字完整擷取(保留原始大小寫、標點符號、縮寫與上標格式):
Weekly Flows: $17.5bn to bonds, $12.9bn to cash, $9.8bn to stocks, $1.3bn to crypto, $0.6bn to gold.

Flows to Know:

• Crypto: $1.3bn inflow, with strong $6.8bn inflow past 6 weeks (Chart 12),
• Global bonds: $17.5bn inflow, averaging $18bn weekly inflow past 4 weeks;
• IG bonds: $5.0bn inflow, 23rd week of inflows,
• Global equities: $9.8bn inflow, averaging $7bn weekly inflow past 3 weeks down from $52bn average weekly inflow in Jul'26...inflows slowing,
• US equities: $3.9bn outflow, with biggest 3-week outflow since Jan'26 ($14.2bn),
• China equities: $1.1bn inflow, first inflow in 6 weeks (Chart 13),
• Materials: $1.9bn inflow, 10th week of inflows (Chart 14).

BofA Private Clients: $4.7tn AUM...66.2% stocks, 17.2% bonds, 9.4% cash (record low); in Treasuries, private clients selling T-bills (biggest weekly outflow in 4 months) and T-notes (1st outflow in 5 weeks) vs small inflow into T-bonds; equity ETF share count up 0.1% past week, up 7.0% YTD; past 4 weeks private clients buying IG bond, municipal bond, TIPS, HY bond ETFs, and selling staples, healthcare, energy ETFs.

BofA Bull & Bear Indicator: down to 9.5 from 9.6 on slowing inflow to stocks and healthcare outflow; "sell signal" triggered May 26th; since then, SPX +1.0%, ACWI +1.5%; "old" Bull & Bear Indicator at 7.6 (see BofA Bull & Bear Indicator report).

On asset allocation: the diversification benefit of holding bonds is fading fast, so yields may stay high even if Treasury buying caps the surge; in the 2000-2019 "secular stagnation" era of rapid globalization & record-low inflation, bonds & stocks did not move together...a 2-3% yield was almost a bonus; today, returns are correlated again (Chart 8), and allocators may require higher yields before moving wholesale into bonds.

Flight to quality: stocks that can generate big free cash flow without excessive debt were the best-performing factor of the last 30 years, better than momentum, growth, dividends (Chart 9); today S&P 500 FCF yield is at record lows, high-FCF stocks (VFLO) are up 37% YTD; in a stagflation year like '22, the index rose 9% vs. SPY -18%.

On AI: despite $1.5tn spent in past 3 years, scant evidence yet of economy-wide productivity gains; in fact, total factor productivity is falling below trend (Chart 10), a measure highly correlated the past 50 years with consumer confidence; sometimes Main St knows what Wall St doesn't.

Events:
• Sept 9th-Nov 4th: Bessent UST buyback program
• Sept 11th: US CPI
• Sept 16th: FOMC (75% probability of hike)
• Sept 18th: BoJ (96% probability of hike)
• Sept 24th: Trump-Xi summit
• Oct 28th: FOMC (6 days before midterms)
• Nov 3rd: US midterm elections
3. 結構化內容還原
(1)全球資產每週資金流向概覽(Weekly Flows)
| 資產類別 (Asset Class) | 流向 (Direction) | 金額 (Amount) | 補充說明 |
|---|---|---|---|
| 全球債券 (Bonds) | 淨流入 | $17.5bn | 過去 4 週平均每週流入 $18bn |
| 現金 (Cash) | 淨流入 | $12.9bn | - |
| 全球股票 (Stocks) | 淨流入 | $9.8bn | 過去 3 週平均流入 $7bn,相較 7 月每週平均 $52bn 顯著放緩 |
| 加密貨幣 (Crypto) | 淨流入 | $1.3bn | 過去 6 週累計流入達 $6.8bn(參見 Chart 12) |
| 黃金 (Gold) | 淨流入 | $0.6bn | - |
(2)重點市場與細項資產流向(Flows to Know)
| 資產 / 板塊細項 | 流向 | 金額 | 趨勢與歷史比對 |
|---|---|---|---|
| 投資級債券 (IG Bonds) | 淨流入 | $5.0bn | 連續第 23 週獲得淨流入 |
| 美國股票 (US Equities) | 淨流出 | $3.9bn | 近 3 週累計流出 $14.2bn,創 2026 年 1 月以來最大 3 週流出 |
| 中國股票 (China Equities) | 淨流入 | $1.1bn | 近 6 週以來首次淨流入(參見 Chart 13) |
| 原物料板塊 (Materials) | 淨流入 | $1.9bn | 連續第 10 週淨流入(參見 Chart 14) |
(3)美銀私人客戶資產配置(BofA Private Clients - AUM $4.7tn)
- 資產佔比:股票 66.2%、債券 17.2%、現金 9.4%(創歷史新低 record low)。
- 美債操作:淨賣出短期國貼息債(T-bills,創 4 個月最大單週流出)與中短期國庫券(T-notes,近 5 週首次流出);小幅買入長期國債(T-bonds)。
- 股票 ETF 持股數:過去一週微增 0.1%,今年累計(YTD)成長 7.0%。
- 近 4 週買賣偏好:
- 買入:投資級債券(IG Bond)、市政債(Municipal Bond)、通膨保值債(TIPS)、高收益債(HY Bond)ETF。
- 賣出:日常消費品(Staples)、醫療保健(Healthcare)、能源(Energy)ETF。
(4)指標與宏觀專題觀點
- 美銀牛熊指標 (BofA Bull & Bear Indicator):
- 由 9.6 微幅回落至 9.5(主因為股票流入減緩與醫療保健板塊流出)。
- 5 月 26 日已觸發「賣出訊號」(Sell signal),觸發至今標普 500 指數(SPX)上漲 1.0%、MSCI 全球指數(ACWI)上漲 1.5%。
- 舊版牛熊指標位於 7.6。
- 資產配置 (On Asset Allocation):
- 持有債券的分散風險效益快速消退,即便財政部購債封頂,殖利率仍可能維持高位。
- 2000–2019 年「長期停滯」時代股債不共振,現今兩者回報再次呈現正相關(參見 Chart 8),資產配置者可能需要更高殖利率才願意大規模進場購債。
- 品質逃聖 / 自由現金流因子 (Flight to Quality):
- 具備強勁自由現金流(FCF)且無過度負債的股票為過去 30 年表現最佳的因子,優於動能、成長與股利因子(參見 Chart 9)。
- 目前標普 500 自由現金流收益率處於歷史低位;高 FCF 股票 ETF(VFLO)今年累計上漲 37%;在 2022 年滯脹期該指數上漲 9%(對比 SPY 跌 18%)。
- 人工智慧議題 (On AI):
- 儘管過去 3 年投入 $1.5 兆美元,全經濟體層面的生產力提升證據依然匱乏。
- 全要素生產力(Total Factor Productivity)已降至趨勢線下方(參見 Chart 10),該指標過去 50 年與消費者信心高度相關。
(5)重大時程表(Events)
| 日期與區間 | 關鍵事件 (Event) | 備註 / 市場關注點 |
|---|---|---|
| 9月9日 – 11月4日 | Bessent 美國國債買回計畫 (Bessent UST buyback program) | 國債市場流動性支持 |
| 9月11日 | 美國 CPI 通膨數據公布 (US CPI) | 央行利率決策依據 |
| 9月16日 | FOMC 利率決議 | 75% 機率升息 |
| 9月18日 | 日本央行 (BoJ) 利率決議 | 96% 機率升息 |
| 9月24日 | 川習會 (Trump-Xi summit) | 中美元首高峰會 |
| 10月28日 | FOMC 利率決議 | 美國期中選舉前 6 天 |
| 11月3日 | 美國期中選舉 (US midterm elections) | 政治政策變數 |
4. 視覺元素與版面配置
- 色彩搭配:採用白底黑字的極簡單色設計,僅在文字內包含一處藍色底線的超連結標籤(
BofA Bull & Bear Indicator report)。 - 字體與排版:採用清爽無襯線字體(Sans-serif),標題與主題關鍵字(如
Weekly Flows:、BofA Private Clients:、Events:)使用加粗(Bold)處理,層次清晰。 - 版面結構:採垂直單欄結構,項目之間以條列點(Bullet Points)及段落空白隔開,利於快速閱讀與資訊檢索。
- 無直接圖表:本圖並未包含走勢圖、柱狀圖或圖示,屬純文字摘要,但文中多處引述圖表代號(如 Chart 8、Chart 9、Chart 10、Chart 12、Chart 13、Chart 14)。
5. 上下文與推測用途
- 內容主題:美國銀行(Bank of America)每週全球研究(Flow Show)機構級報告之重點導讀與摘要筆記。
- 推測用途:主要供機構投資人、總體經濟分析師、基金經理人或交易員快速掌握最新每週全球資金動態、美銀私人客戶籌碼變化、股債相關性走勢、自由現金流因子風險偏好,以及備戰 9 月至 11 月的美日央行決議與美中高層對談等重磅總經事件。
BofA每週資金流向與總經報告
本圖片為美國銀行(BofA)每週資金流向與市場觀點報告之文字摘要。內容指出全球債券及現金持續獲資金流入,美股則出現近期最大規模流出;美銀私人客戶現金比重降至 9.4% 歷史新低,牛熊指標小幅回落至 9.5。此外,報告強調股債相關性回升削弱分散風險效益、自由現金流因子顯著跑贏大市,並提及 AI 投資尚未顯現整體生產力提振。末段詳列 9 月至 11 月 FOMC 決議、美日央行動向及美期中選舉等重大事件時程。