CTA與SPX選擇權流向分析
2026-08-12 · 含原圖
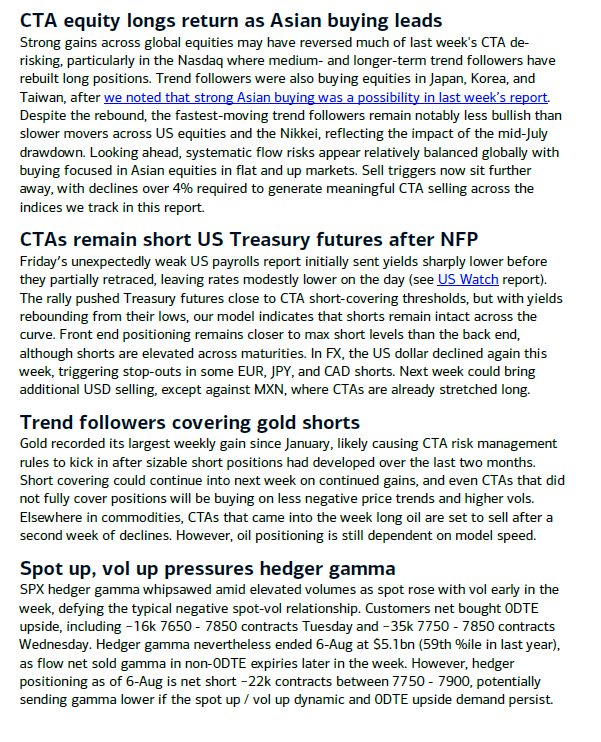
image_1.png 詳細分析報告
1. 圖片類型與整體說明
- 圖片類型:這是一張金融機構市場研究與資金流向報告(Market Research / Flow Report)的網頁文字截圖。
- 整體說明:該圖片包含四個主要的英文主題區塊,內容主要聚焦於商品交易顧問(CTA, Commodity Trading Advisors)及系統化趨勢跟隨(Trend Following)策略在多種資產類別(股票、美國國債期貨、大宗商品如黃金與原油、外匯)的最新倉位變化與流向,並深度剖析標普 500(SPX)選擇權市場中造市商/對沖者 Gamma(Hedger Gamma)以及 0DTE(當日到期選擇權)買盤的動態變化。
2. 所有可見文字(逐字擷取)
註:以下完整逐字還原截圖中出現的所有標題與內文,包含原始大小寫、拼寫、標點符號及藍色底線超連結標示。
【區塊一】
- 標題:
CTA equity longs return as Asian buying leads - 內文:
Strong gains across global equities may have reversed much of last week's CTA de-risking, particularly in the Nasdaq where medium- and longer-term trend followers have rebuilt long positions. Trend followers were also buying equities in Japan, Korea, and Taiwan, afterwe noted that strong Asian buying was a possibility in last week’s report. Despite the rebound, the fastest-moving trend followers remain notably less bullish than slower movers across US equities and the Nikkei, reflecting the impact of the mid-July drawdown. Looking ahead, systematic flow risks appear relatively balanced globally with buying focused in Asian equities in flat and up markets. Sell triggers now sit further away, with declines over 4% required to generate meaningful CTA selling across the indices we track in this report.
【區塊二】
- 標題:
CTAs remain short US Treasury futures after NFP - 內文:
Friday’s unexpectedly weak US payrolls report initially sent yields sharply lower before they partially retraced, leaving rates modestly lower on the day (seeUS Watchreport). The rally pushed Treasury futures close to CTA short-covering thresholds, but with yields rebounding from their lows, our model indicates that shorts remain intact across the curve. Front end positioning remains closer to max short levels than the back end, although shorts are elevated across maturities. In FX, the US dollar declined again this week, triggering stop-outs in some EUR, JPY, and CAD shorts. Next week could bring additional USD selling, except against MXN, where CTAs are already stretched long.
【區塊三】
- 標題:
Trend followers covering gold shorts - 內文:
Gold recorded its largest weekly gain since January, likely causing CTA risk management rules to kick in after sizable short positions had developed over the last two months. Short covering could continue into next week on continued gains, and even CTAs that did not fully cover positions will be buying on less negative price trends and higher vols. Elsewhere in commodities, CTAs that came into the week long oil are set to sell after a second week of declines. However, oil positioning is still dependent on model speed.
【區塊四】
- 標題:
Spot up, vol up pressures hedger gamma - 內文:
SPX hedger gamma whipsawed amid elevated volumes as spot rose with vol early in the week, defying the typical negative spot-vol relationship. Customers net bought 0DTE upside, including ~16k 7650 - 7850 contracts Tuesday and ~35k 7750 - 7850 contracts Wednesday. Hedger gamma nevertheless ended 6-Aug at $5.1bn (59th %ile in last year), as flow net sold gamma in non-0DTE expiries later in the week. However, hedger positioning as of 6-Aug is net short ~22k contracts between 7750 - 7900, potentially sending gamma lower if the spot up / vol up dynamic and 0DTE upside demand persist.
3. 結構化內容與數據還原
將圖中所提及之各項資產趨勢、CTA 流向與選擇權關鍵數據整理如下表格:
表一:資產類別與 CTA / 系統化資金流向摘要
| 資產類別 (Asset Class) | 標的 / 市場 (Market) | 當前倉位與流向 (Positioning & Flow) | 關鍵驅動因素與觀察條件 (Key Drivers & Details) |
|---|---|---|---|
| 股票 (Equities) | 全球股票 / Nasdaq | 中長期趨勢跟隨者重新建立多頭倉位 | 逆轉上週的去風險(de-risking);觸發顯著賣壓需指數下挫超過 4% |
| 亞洲(日本、韓國、台灣) | 買盤強勁(Asian buying) | 平盤或上漲市場中買盤主要集中於亞洲股市 | |
| 美股 / 日經 (Nikkei) | 快速趨勢跟隨者看多程度較慢速者保守 | 反映 7 月中旬拉回(mid-July drawdown)帶來的衝擊 | |
| 利率/債券 (Rates) | 美國國債期貨 | 維持全殖利率曲線空頭 (Shorts remain intact) | 非農(NFP)數據偏弱曾引發反彈,但殖利率回升使空頭未被逼退 |
| 短端 vs 長端 | 短端倉位接近極限空頭(Max short levels) | 各天期空頭倉位均處於高位 | |
| 外匯 (FX) | 美元 (USD) / 交叉盤 | 美元走弱,觸發部分歐元、日圓、加幣空頭停損 | 下週美元可能持續面臨賣壓;墨西哥披索(MXN)則極度看多 |
| 大宗商品 (Commodities) | 黃金 (Gold) | 空頭回補 (Short covering) | 錄得自 1 月以來最大單週漲幅,觸發 CTA 風控機制 |
| 原油 (Oil) | 面臨賣壓 (Set to sell) | 原油價格連續第二週下跌,調倉狀況取決於模型速度 |
表二:標普 500(SPX)衍生品與對沖者 Gamma (Hedger Gamma) 數據
| 時間 / 項目 | 關鍵數據與履約價區間 | 詳細說明 |
|---|---|---|
| 週二 (Tuesday) | ~16k 合約 (履約價 7650 - 7850) | 客戶淨買入 0DTE 上行看漲選擇權 (0DTE upside) |
| 週三 (Wednesday) | ~35k 合約 (履約價 7750 - 7850) | 客戶大幅加碼買入 0DTE 看漲選擇權 |
| 截至 8 月 6 日 | $5.1bn (近一年第 59 百分位數) | Hedger Gamma 結算總額(後期非 0DTE 選擇權出現 Gamma 淨賣壓) |
| 截至 8 月 6 日 | 淨空頭 ~22k 合約 (履約價 7750 - 7900) | 對沖者特定區間倉位;若現貨/隱波同升與 0DTE 需求持續,Gamma 可能被拉低 |
4. 視覺元素與版面配置
- 色彩系統:
* 背景色:簡潔無雜質的白色背景(
#FFFFFF)。 * 文字顏色:主體內文與標題採用深灰至黑色文字,符合標準文獻閱讀對比度。 * 連結視覺:文中嵌入的交叉參考報告(例如we noted that strong Asian buying was a possibility in last week’s report以及US Watch)使用了經典的藍色底線字體標示。 - 字體與版面編排: * 採用高可讀性的無襯線字型(Sans-serif)。 * 每個子區塊開頭均使用加粗大字體標題,與正文區分明確。 * 段落與段落之間留白適當,未夾帶任何視覺裝飾、圖示或圖表元件。
5. 上下文與推測用途
- 主題範疇:量化資金流向分析(Quantitative Flow Analysis)、CTA 模型倉位評估、選擇權 Gamma 及隱含波動率市場動態。
- 推測來源:極可能來自大型國際投資銀行(如 Goldman Sachs、J.P. Morgan 或 Morgan Stanley)的大宗經紀(Prime Brokerage)或衍生品策略(Quantitative & Derivative Strategy)團隊向機構客戶發布的週度/每日市場流向簡報(Market Flow Report)。
- 實際用途:協助對沖基金經理人、資產配置者與交易員掌握巨量系統化資金(CTA)在各市場的強制買賣觸發點(Buy/Sell Triggers)與造市商對沖防線,作為短線市場流動性與波動風險防範之決策依據。
CTA與SPX選擇權流向分析
本圖為一份金融機構的市場流向研究報告截圖,重點分析商品交易顧問(CTA)與系統化策略在股票、美債期貨、黃金、原油與外匯等資產的最新倉位變化,並深入剖析標普 500(SPX)現貨與波動率同升對造市商 Gamma 對沖造成的壓力。報告詳細列出亞洲買盤帶動股票多頭回歸、黃金引發空頭回補以及 0DTE 看漲選擇權大量買進等數據,為機構投資人與交易員提供關鍵的大資金動態與市場流向參考。