高盛CTA資金流向與SPX樞紐分析
2026-09-16 · 含原圖
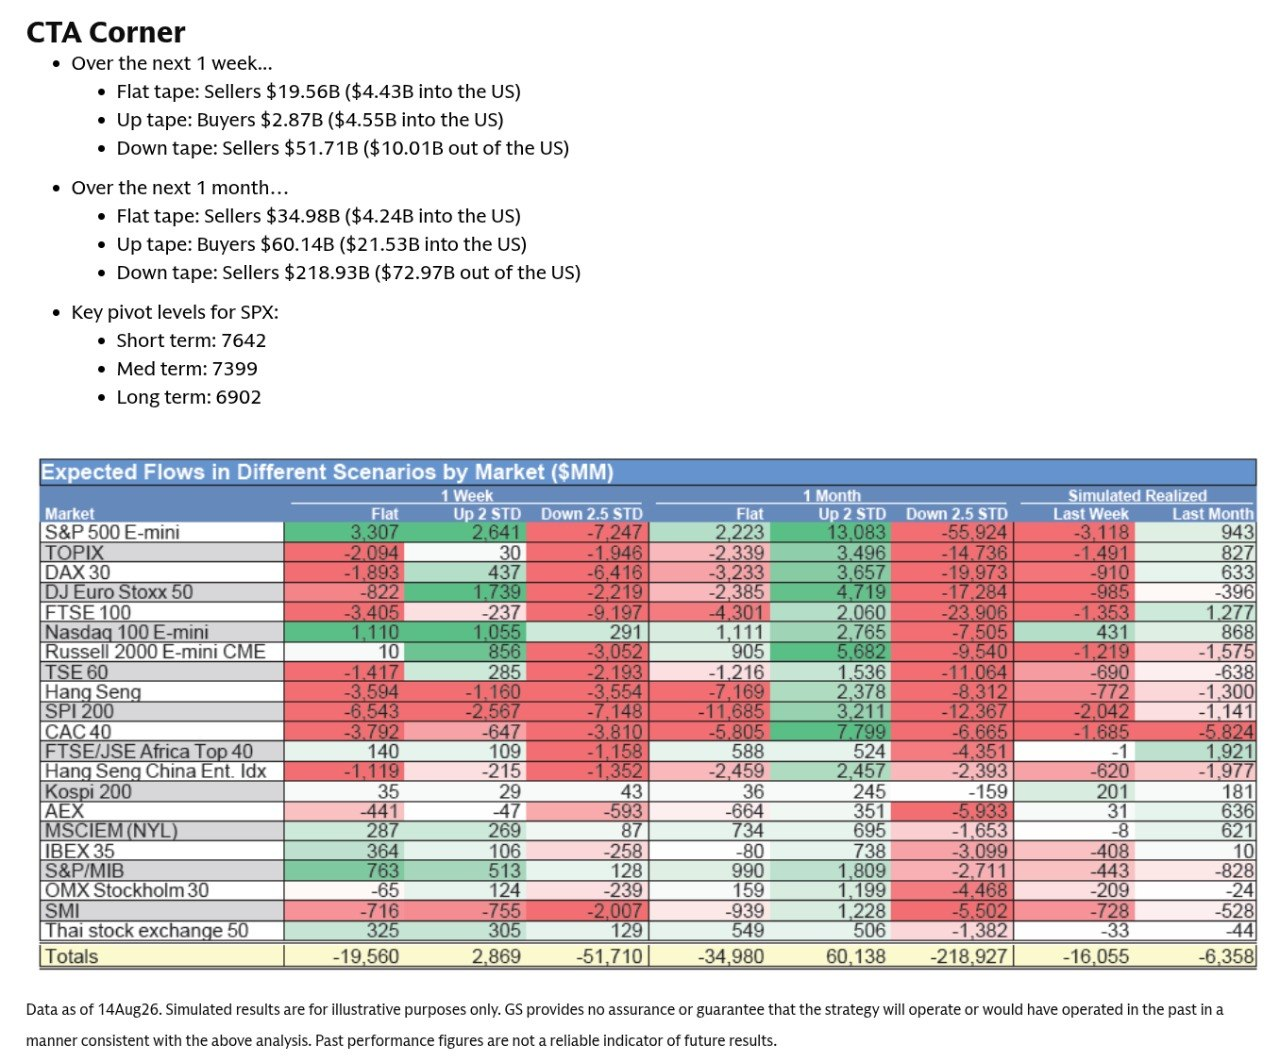
image_1.png 詳細分析報告
1. 圖片類型與整體說明
本圖片為一張來自機構投資研究報告(高盛 Goldman Sachs 旗下 CTA / 系統性策略研究)的裁切截圖。主題為 「CTA Corner」,主要針對全球主要股指期貨在未來 1 週及 1 個月內,於不同市場情境(平盤、上漲 2 個標準差、下跌 2.5 個標準差)下,量化模型推算的 CTA(商品交易顧問 / 趨勢跟隨基金)預期資金流向(Expected Flows),並列出標普 500 指數(SPX)的關鍵樞紐關卡(Key Pivot Levels)與歷史模擬實現流量。
2. 所有可見文字(逐字擷取)
以下完整保留圖片中出現的原始文字、符號、大小寫與數據:
CTA Corner
• Over the next 1 week...
  • Flat tape: Sellers $19.56B ($4.43B into the US)
  • Up tape: Buyers $2.87B ($4.55B into the US)
  • Down tape: Sellers $51.71B ($10.01B out of the US)

• Over the next 1 month...
  • Flat tape: Sellers $34.98B ($4.24B into the US)
  • Up tape: Buyers $60.14B ($21.53B into the US)
  • Down tape: Sellers $218.93B ($72.97B out of the US)

• Key pivot levels for SPX:
  • Short term: 7642
  • Med term: 7399
  • Long term: 6902

Expected Flows in Different Scenarios by Market ($MM)
Market | 1 Week (Flat, Up 2 STD, Down 2.5 STD) | 1 Month (Flat, Up 2 STD, Down 2.5 STD) | Simulated Realized (Last Week, Last Month)

Totals | -19,560 | 2,869 | -51,710 | -34,980 | 60,138 | -218,927 | -16,055 | -6,358

Data as of 14Aug26. Simulated results are for illustrative purposes only. GS provides no assurance or guarantee that the strategy will operate or would have operated in the past in a manner consistent with the above analysis. Past performance figures are not a reliable indicator of future results.
3. 結構化內容還原
(1) 文字摘要條列
- 未來 1 週預估資金流向 (Over the next 1 week):
- 平盤 (Flat tape):賣出 \$19.56B(其中 \$4.43B 流入美國)
- 上漲 (Up tape):買進 \$2.87B(其中 \$4.55B 流入美國)
- 下跌 (Down tape):賣出 \$51.71B(其中 \$10.01B 流出美國)
- 未來 1 個月預估資金流向 (Over the next 1 month):
- 平盤 (Flat tape):賣出 \$34.98B(其中 \$4.24B 流入美國)
- 上漲 (Up tape):買進 \$60.14B(其中 \$21.53B 流入美國)
- 下跌 (Down tape):賣出 \$218.93B(其中 \$72.97B 流出美國)
- SPX 關鍵樞紐點位 (Key pivot levels for SPX):
- 短期 (Short term):7642
- 中期 (Med term):7399
- 長期 (Long term):6902
(2) 各市場預估資金流向表格(單位:百萬美元 $MM)
| Market | 1 Week: Flat | 1 Week: Up 2 STD | 1 Week: Down 2.5 STD | 1 Month: Flat | 1 Month: Up 2 STD | 1 Month: Down 2.5 STD | Simulated Realized: Last Week | Simulated Realized: Last Month |
|---|---|---|---|---|---|---|---|---|
| S&P 500 E-mini | 3,307 | 2,641 | -7,247 | 2,223 | 13,083 | -55,924 | -3,118 | 943 |
| TOPIX | -2,094 | 30 | -1,946 | -2,339 | 3,496 | -14,736 | -1,491 | 827 |
| DAX 30 | -1,893 | 437 | -6,416 | -3,233 | 3,657 | -19,973 | -910 | 633 |
| DJ Euro Stoxx 50 | -822 | 1,739 | -2,219 | -2,385 | 4,719 | -17,284 | -985 | -396 |
| FTSE 100 | -3,405 | -237 | -9,197 | -4,301 | 2,060 | -23,906 | -1,353 | 1,277 |
| Nasdaq 100 E-mini | 1,110 | 1,055 | 291 | 1,111 | 2,765 | -7,505 | 431 | 868 |
| Russell 2000 E-mini CME | 10 | 856 | -3,052 | 905 | 5,682 | -9,540 | -1,219 | -1,575 |
| TSE 60 | -1,417 | 285 | -2,193 | -1,216 | 1,536 | -11,064 | -690 | -638 |
| Hang Seng | -3,594 | -1,160 | -3,554 | -7,169 | 2,378 | -8,312 | -772 | -1,300 |
| SPI 200 | -6,543 | -2,567 | -7,148 | -11,685 | 3,211 | -12,367 | -2,042 | -1,141 |
| CAC 40 | -3,792 | -647 | -3,810 | -5,805 | 7,799 | -6,665 | -1,685 | -5,824 |
| FTSE/JSE Africa Top 40 | 140 | 109 | -1,158 | 588 | 524 | -4,351 | -1 | 1,921 |
| Hang Seng China Ent. Idx | -1,119 | -215 | -1,352 | -2,459 | 2,457 | -2,393 | -620 | -1,977 |
| Kospi 200 | 35 | 29 | 43 | 36 | 245 | -159 | 201 | 181 |
| AEX | -441 | -47 | -593 | -664 | 351 | -5,933 | 31 | 636 |
| MSCIEM (NYL) | 287 | 269 | 87 | 734 | 695 | -1,653 | -8 | 621 |
| IBEX 35 | 364 | 106 | -258 | -80 | 738 | -3,099 | -408 | 10 |
| S&P/MIB | 763 | 513 | 128 | 990 | 1,809 | -2,711 | -443 | -828 |
| OMX Stockholm 30 | -65 | 124 | -239 | 159 | 1,199 | -4,468 | -209 | -24 |
| SMI | -716 | -755 | -2,007 | -939 | 1,228 | -5,502 | -728 | -528 |
| Thai stock exchange 50 | 325 | 305 | 129 | 549 | 506 | -1,382 | -33 | -44 |
| Totals | -19,560 | 2,869 | -51,710 | -34,980 | 60,138 | -218,927 | -16,055 | -6,358 |
4. 視覺元素與版面配置
- 色彩系統 (Color Heatmap): * 綠色背景 (Light Green):代表正數(資金淨買入/淨流入),例如 S&P 500、Nasdaq 100 在平盤或上漲情境下均顯示淺綠色。 * 粉紅色/紅色背景 (Light Red/Pink):代表負數(資金淨賣出/淨流出),例如在 Down 2.5 STD 劇烈下跌情境下,全球大部分指數(如 S&P 500 -$55.92B、FTSE 100 -$23.9B)均呈深淺不一的紅色警告色。
- 字體與排版 (Typography & Hierarchy):
* 標題區:頂端以大字體黑色粗體標示
CTA Corner。 * 重點摘要區:採用黑色圓點條列式清單(Bullet list),重點明確。 * 表格標題區:採用高盛經典深藍色(Steel Blue)作為背景色,搭配白色粗體字。 - 表格底欄 (Totals & Disclaimer): * 總計列(Totals)上下加上實線分隔線,背景填滿灰黃/淡色以突顯總額。 * 最下方附帶小字體免責聲明(Data as of 14Aug26... GS provides no assurance...)。
5. 上下文與推測用途
- 機構背景:本資料出自高盛(Goldman Sachs)機構前端交易與系統性策略團隊(GS Prime Brokerage / Systematic Trading Desk)。
- 分析核心:CTA 基金採用量化模型與趨勢跟隨(Trend-following)策略。當市場出現突破或大幅下挫時,系統會被動發動大規模追價或停損賣壓。
- 市場警訊: 1. 若市場面臨 -2.5 STD 劇烈下跌,1 個月內全球 CTA 可能釋放出高達 $218.93B(超過 2100 億美元) 的極端拋售賣壓,其中美股佔去 $72.97B。 2. 若市場維持平盤(Flat),1 週內仍預計有 $19.56B 的賣壓,顯示目前 CTA 全球整體部位偏多,平盤可能伴隨部位減碼。
- 用途:供機構交易員、宏觀對沖基金經理人與風險管理人員評估流動性風險、預估市場關鍵反轉點(Pivot Levels)以及避險需求。
高盛CTA資金流向與SPX樞紐分析
這張圖片為高盛(Goldman Sachs)發布的「CTA Corner」機構量化報告截圖,展示截至 2026 年 8 月 14 日全球商品交易顧問(CTA)基金在不同市場情境下的預期資金流向與 S&P 500 指數樞紐點位。數據顯示,若市場出現極端下跌(-2.5 STD),一個月內全球 CTA 可能面臨高達 2,189 億美元的系統性拋售賣壓;若市場上漲(+2 STD),則預期將帶來 601 億美元的追價買盤。