美銀CTA趨勢跟隨模型報告
2026-08-12 · 含原圖
以下是針對工作區中 image_3.png 圖片的詳細分析報告:
image_3.png 詳細分析報告
1. 圖片類型與整體說明
- 圖片類型:投資銀行研究報告圖表截圖(Financial Research Report Table / Chart Screenshot)。
- 發布機構:美國銀行全球研究部(BofA Global Research)。
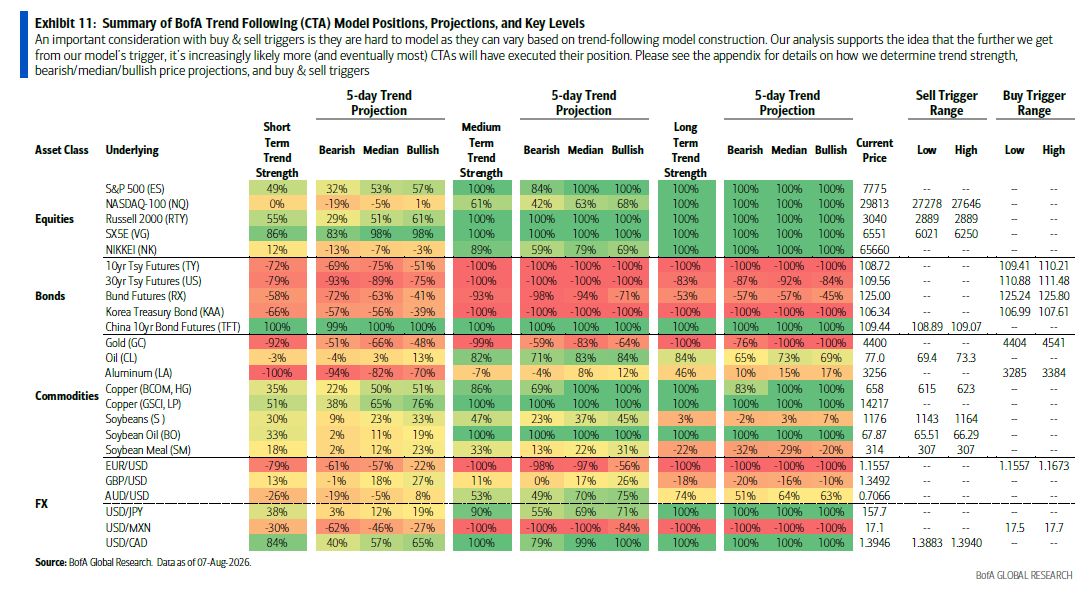
- 圖表名稱:Exhibit 11: Summary of BofA Trend Following (CTA) Model Positions, Projections, and Key Levels。
- 資料基準日:2026 年 8 月 7 日(Data as of 07-Aug-2026)。
- 整體說明:本張圖表為美銀(BofA)針對 CTA(商品交易顧問 / 趨勢跟隨策略基金)模型所做出的持倉狀態與追價/停損預估報告。內容涵蓋股票(Equities)、債券(Bonds)、大宗商品(Commodities)及外匯(FX)四大資產類別共 24 個主要期貨與匯率標的,呈現其短、中、長期的趨勢強度(Trend Strength)、5 天趨勢預測(5-day Trend Projection),以及潛在觸發 CTA 減碼賣出(Sell Trigger)或加碼買進(Buy Trigger)的關鍵價格區間。
2. 所有可見文字擷取(原文照錄)
標題與說明文字
- 主標題:
Exhibit 11: Summary of BofA Trend Following (CTA) Model Positions, Projections, and Key Levels - 內文說明註記:
An important consideration with buy & sell triggers is they are hard to model as they can vary based on trend-following model construction. Our analysis supports the idea that the further we get from our model's trigger, it's increasingly likely more (and eventually most) CTAs will have executed their position. Please see the appendix for details on how we determine trend strength, bearish/median/bullish price projections, and buy & sell triggers
表格標頭(Headers)
Asset ClassUnderlyingShort Term Trend Strength5-day Trend ProjectionBearish|Median|BullishMedium Term Trend StrengthLong Term Trend StrengthCurrent PriceSell Trigger Range(Low,High)Buy Trigger Range(Low,High)
表格主要標的與分類名稱
- Equities:
S&P 500 (ES),NASDAQ-100 (NQ),Russell 2000 (RTY),SX5E (VG),NIKKEI (NK) - Bonds:
10yr Tsy Futures (TY),30yr Tsy Futures (US),Bund Futures (RX),Korea Treasury Bond (KAA),China 10yr Bond Futures (TFT) - Commodities:
Gold (GC),Oil (CL),Aluminum (LA),Copper (BCOM, HG),Copper (GSCI, LP),Soybeans (S),Soybean Oil (BO),Soybean Meal (SM) - FX:
EUR/USD,GBP/USD,AUD/USD,USD/JPY,USD/MXN,USD/CAD
頁腳文字
Source: BofA Global Research. Data as of 07-Aug-2026.BofA GLOBAL RESEARCH
3. 結構化內容(完整數據表格還原)
| Asset Class | Underlying | Short Term Trend Strength | 5-day Trend Proj. (Short) Bearish | 5-day Trend Proj. (Short) Median | 5-day Trend Proj. (Short) Bullish | Medium Term Trend Strength | 5-day Trend Proj. (Med) Bearish | 5-day Trend Proj. (Med) Median | 5-day Trend Proj. (Med) Bullish | Long Term Trend Strength | 5-day Trend Proj. (Long) Bearish | 5-day Trend Proj. (Long) Median | 5-day Trend Proj. (Long) Bullish | Current Price | Sell Trigger Range Low | Sell Trigger Range High | Buy Trigger Range Low | Buy Trigger Range High |
|---|---|---|---|---|---|---|---|---|---|---|---|---|---|---|---|---|---|---|
| Equities | S&P 500 (ES) | 49% | 32% | 53% | 57% | 100% | 84% | 100% | 100% | 100% | 100% | 100% | 100% | 7775 | -- | -- | -- | -- |
| NASDAQ-100 (NQ) | 0% | -19% | -5% | 1% | 61% | 42% | 63% | 68% | 100% | 100% | 100% | 100% | 29813 | 27278 | 27646 | -- | -- | |
| Russell 2000 (RTY) | 55% | 29% | 51% | 61% | 100% | 100% | 100% | 100% | 100% | 100% | 100% | 100% | 3040 | 2889 | 2889 | -- | -- | |
| SX5E (VG) | 86% | 83% | 98% | 98% | 100% | 100% | 100% | 100% | 100% | 100% | 100% | 100% | 6551 | 6021 | 6250 | -- | -- | |
| NIKKEI (NK) | 12% | -13% | -7% | -3% | 89% | 59% | 79% | 69% | 100% | 100% | 100% | 100% | 65660 | -- | -- | -- | -- | |
| Bonds | 10yr Tsy Futures (TY) | -72% | -69% | -75% | -51% | -100% | -100% | -100% | -100% | -100% | -100% | -100% | -100% | 108.72 | -- | -- | 109.41 | 110.21 |
| 30yr Tsy Futures (US) | -79% | -93% | -89% | -75% | -100% | -100% | -100% | -100% | -83% | -87% | -92% | -84% | 109.56 | -- | -- | 110.88 | 111.48 | |
| Bund Futures (RX) | -58% | -72% | -63% | -41% | -93% | -98% | -94% | -71% | -53% | -57% | -57% | -45% | 125.00 | -- | -- | 125.24 | 125.80 | |
| Korea Treasury Bond (KAA) | -66% | -57% | -56% | -39% | -100% | -100% | -100% | -100% | -100% | -100% | -100% | -100% | 106.34 | -- | -- | 106.99 | 107.61 | |
| China 10yr Bond Futures (TFT) | 100% | 99% | 100% | 100% | 100% | 100% | 100% | 100% | 100% | 100% | 100% | 100% | 109.44 | 108.89 | 109.07 | -- | -- | |
| Commodities | Gold (GC) | -92% | -51% | -66% | -48% | -99% | -59% | -83% | -64% | -100% | -76% | -100% | -100% | 4400 | -- | -- | 4404 | 4541 |
| Oil (CL) | -3% | -4% | 3% | 13% | 82% | 71% | 83% | 84% | 84% | 65% | 73% | 69% | 77.0 | 69.4 | 73.3 | -- | -- | |
| Aluminum (LA) | -100% | -94% | -82% | -70% | -7% | -4% | 8% | 12% | 46% | 10% | 15% | 17% | 3256 | -- | -- | 3285 | 3384 | |
| Copper (BCOM, HG) | 35% | 22% | 50% | 51% | 86% | 69% | 100% | 100% | 100% | 83% | 100% | 100% | 658 | 615 | 623 | -- | -- | |
| Copper (GSCI, LP) | 51% | 38% | 65% | 76% | 100% | 100% | 100% | 100% | 100% | 100% | 100% | 100% | 14217 | -- | -- | -- | -- | |
| Soybeans (S) | 30% | 9% | 23% | 33% | 47% | 23% | 37% | 45% | 3% | -2% | 3% | 7% | 1176 | 1143 | 1164 | -- | -- | |
| Soybean Oil (BO) | 33% | 2% | 11% | 19% | 100% | 100% | 100% | 100% | 100% | 100% | 100% | 100% | 67.87 | 65.51 | 66.29 | -- | -- | |
| Soybean Meal (SM) | 18% | 2% | 12% | 23% | 33% | 13% | 22% | 31% | -22% | -32% | -29% | -20% | 314 | 307 | 307 | -- | -- | |
| FX | EUR/USD | -79% | -61% | -57% | -22% | -100% | -98% | -97% | -56% | -100% | -100% | -100% | -100% | 1.1557 | -- | -- | 1.1557 | 1.1673 |
| GBP/USD | 13% | -1% | 18% | 27% | 11% | 0% | 17% | 26% | -18% | -20% | -16% | -10% | 1.3492 | -- | -- | -- | -- | |
| AUD/USD | -26% | -19% | -5% | 8% | 53% | 49% | 70% | 75% | 74% | 51% | 64% | 63% | 0.7066 | -- | -- | -- | -- | |
| USD/JPY | 38% | 3% | 12% | 19% | 90% | 55% | 69% | 71% | 100% | 100% | 100% | 100% | 157.7 | -- | -- | -- | -- | |
| USD/MXN | -30% | -62% | -46% | -27% | -100% | -100% | -100% | -84% | -100% | -100% | -100% | -100% | 17.1 | -- | -- | 17.5 | 17.7 | |
| USD/CAD | 84% | 40% | 57% | 65% | 100% | 79% | 99% | 100% | 100% | 100% | 100% | 100% | 1.3946 | 1.3883 | 1.3940 | -- | -- |
4. 視覺元素與版面設計分析
- 配色 scheme(熱力圖視覺化 Heatmap): * 綠色色調(深綠 / 綠色):代表強烈看多或正向趨勢強度(例如 80% 至 100%),顯示 CTA 策略高度多頭部位。 * 紅色 / 粉紅色色調:代表強烈看空或負向趨勢強度(例如 -50% 至 -100%),顯示 CTA 策略處於空頭或大規模避險狀態。 * 黃色 / 橘色色調:代表中性、盤整或趨勢較弱的區間(例如 -30% 至 +30% 之間)。
- 圖表結構與層次: * 頂部區域:左側有藍色長條矩形做為圖表標記(Exhibit 11),搭配黑字黑底加粗標題,下附註釋說明。 * 資產類別分區:左側 Asset Class 依 Equities、Bonds、Commodities、FX 縱向分組。 * 劃分線設計:FX 類別中,AUD/USD 與 USD/JPY 之間設有一條黑色虛線,用以區隔非美貨幣主體與美金計價交叉對。 * 欄位劃分:頂部欄位透過水平底線將「Short Term」、「Medium Term」、「Long Term」及其對應的 5 天預測(Bearish / Median / Bullish)進行組別包覆,右側特別拉出 Current Price 以及觸發條件買賣區間(Sell Trigger Range / Buy Trigger Range)。
5. 上下文與推測用途
- 資料來源:美銀證券全球研究(BofA Global Research)。
- 市場背景:CTA(Commodity Trading Advisors)為市場上極具影響力的量化趨勢跟隨模型基金。其部位變動常會帶動巨額流動性,引發市場突破或追價。
- 主要用途: 1. 監控 CTA 持倉曝險:幫助機構交易員與基金經理人瞭解當前 CTA 量化模型在各大資產(美股、美債、歐債、黃金、原油、外匯)的短中長期籌碼多空分佈。 2. 鎖定關鍵觸發價格(Trigger Levels):當標的價格觸及「Sell Trigger Range」或「Buy Trigger Range」時,預計會誘發大量 CTA 模型產生程式化止損或加碼追單,協助交易員預防市場波動劇烈放大的轉折點。
美銀CTA趨勢跟隨模型報告
本圖片為美國銀行(BofA Global Research)發布的研究報告圖表「Exhibit 11」,展示截至 2026 年 8 月 7 日 CTA 趨勢跟隨模型在股票、債券、大宗商品與外匯四大資產類別的持倉部位與預測。圖中完整列出各標的於短、中、長期下的趨勢強度與 5 天預測情境,並標示觸發模型進一步買進或賣出的關鍵價格區間。該圖主要用於協助機構投資人與交易員掌握市場 CTA 資金的流向與潛在調倉點位。